Using JRNI
Appointments
Creating and managing bookings via Call Center
Personal Booking Links
Locating bookings and customers
Resolving conflicting shift patterns
Locations overview
Creating pre and post appointment questions
Changing the staff member or resource on an upcoming booking
Adding attendees to existing and upcoming bookings
Rescheduling and canceling bookings
Blocking out time on the calendar
Creating appointment bookings
Calendar overview
Parent and Child level overview
Using Check In for appointments
Staff
Editing and removing staff members
Configuring availability by method
Creating staff members
Creating and managing staff availability
Creating availability for multi-location staff
Services
Creating and editing Services
Service image requirments
Private services
Categories
Configuring the reservation workflow
Creating service schedules
Resources
Analytics
All Dashboards
Using the Capacity Dashboard
Using the Basic Dashboard
Using the Event Dashboard
Using the Conversion Dashboard
Using the HQ Dashboard
Using the Appointment Dashboard
Using the lead time dashboard
Insight Hub *New*
Creating dashboards
Creating Your First Dashboard - Format Tab Section Overview
Creating Your First Dashboard - Simple Steps
Creating Your First Dashboard - Interactive Elements Overview
Creating Your First Dashboard - Chart Components Overview
Creating Your First Dashboard - Data Tab Overview
Features
The new jrni Insight Hub
Analytics overview
Creating your own Reports
Google Analytics - New Customer Journeys
Setting up KPI targets and alerts
Drilling down into your data
Using Table Calculations
Filtering Dashboard and Report data
Creating and modifying a Dashboard
Sending, scheduling, and downloading Reports/Dashboards
Exploring the library of Dashboards and Reports
Booking journeys
Customer Journey's (Journey Builder)
Journey builder
Link Builder
Multi Service Journeys (Appointments)
How to use iframes
How to deeplink into booking journeys
Direct Links
Customer Journeys
Appointment automation
Queuing
Real-time Dashboard
Overview of the Concierge page
Setting up a virtual queue
Overview of JRNI Virtual Queuing
Setting up and managing a display board
Managing live queues via the Concierge page
How customers can join a live queue
Events
Events setup and config
Event journeys
Events Staff Experience
Events Bulk Import
*New* Event landing page builder
Branding
Business info
How to translate your content
Account Settings & Administration
Understanding user roles and permissions
How to reset or update your JRNI password
Creating and managing user access
Connectors & API
Calendar
Video
CRM
Salesforce
Guide to Salesforce Integration with JRNI
Add BookingBug updates to Chatter
Set up a booking journey in Salesforce
Manage user permissions and profiles
Use Studio inside Salesforce
Standard and Custom object mapping
Link JRNI staff to Salesforce users
Map customers, appointments and events
Set up the data sync
SAML
Integrating with Yext for JRNI Appointments
Release notes
Upcoming Release notes - 15th of July 2026
Release notes - 1st of July 2026
Release notes - 10th of June 2026
Release notes - April 2026
Release Notes - March 2026
(December - January 2026)
V8.21-V.8.21.2 (November 2025)
V.8.19-V.8.21 (October 2025)
V.8.17-V.8.18 (September 2025)
V8.15-V.8.16 (August 2025)
V.8.12 - V8.14 (July 2025)
V.8.11 (June 2025)
V8.10.1-V.8. (May 2025)
V8.10 - V8.11 (March 2025)
V8.8 - V.8.9 (February 2025)
V8.6 - V8.7 (January 2025)
V8.30 -V8.40 (November 2024)
V8.50 (December 2024)
V8.20 (October 2024)
V8.00-V8.10 (September 2024)
V7.55-V7.57 (August 2024)
V7.54 - V7.55 (July 2024)
V7.52-V7.53 (June 2024)
V7.49-V.51(May 2024)
V.7.47-V.7.48 (April 2024)
V.7.46 - V7.47 (March 2024)
V.7.45 (February 2024)
V7.42 - V.7.44 (January 2024)
V7.41.0 (Dec 14 2023)
V7.40.0 (December 11 2023)
V7.39.0 (December 1 2023)
V7.38.0 (November 20 2023)
V7.37.0 (Nov 7 2023)
V7.36.0 (Oct 30 2023)
V7.35.0 (Oct 18 2023)
V7.34.0 (Oct 13 2023)
V7.33.0 (Sep 28 2023)
V7.32.0 (Sep 28 2023)
V7.31.0 (Sep 20 2023)
V7.30.0 (Sep 20 2023)
V7.29.0 (Sep 7 2023)
V7.28.0 (Aug 29 2023)
V7.27.0 (Aug 29 2023)
V7.26.0 (Aug 20 2023)
V7.25.0 (Aug 9 2023)
V7.24.0 (Aug 9 2023)
V7.23.0 (July 31 2023)
V7.22.0 (July 24 2023)
V7.21.0 (July 18 2023)
V7.20.0 (July 5 2023)
V7.19.0 (June 29 2023)
V7.18.0 (June 26 2023)
V7.17.0 (June 14 2023)
V7.1.0 (March 6 2023)
V7.2.0 (March 8 2023)
V7.0.0 (February 9 2023)
V7.16.0 (June 8 2023)
V7.15.0 (June 1 2023)
V7.14.0 (June 7 2022)
V7.11.0 (April 24 2023)
V7.10.0 (April 20 2023)
V7.9.0 (April 12 2023)
V7.8.0 (April 5 2023)
V7.7.0 (March 30 2023)
V7.6.0 (March 29 2023)
V7.5.1 (March 20 2023)
V7.5.0 (March 16 2023)
V7.4.0 (March 11 2023)
V7.3.0 (March 9 2023)
Table of Contents
- All Categories
- Using JRNI
- Analytics
- Filtering Dashboard and Report data
Filtering Dashboard and Report data
With JRNI Analytics Plus, you have the ability to restrict data using set criteria. This way, you can narrow down the results of your query and focus on the information you’re most interested in.
Adding a filter to a dashboard
- Navigate to a dashboard.
- Click the three-dot icon from the right-hand corner, and then click Edit dashboard.
- Click Filters from the top menu, and then click Add filter.
- The Add Filter window will open, where you can search for a field dimension to filter by.
- Locate a field using the search bar, or by using the dropdown arrows.
- You will now be able to choose settings for your filter; such as title, control, display and values.
- Click Add once you’re done.
In the example above, we added the Appointment Creation Date field, and updated the Control setting to a date range, so that we can filter the dashboard to only show data for appointments created within a certain timeframe.
Tiles to Update
If you have multiple tiles on your dashboard, the filter will automatically apply to all tiles that were created from the same Explore category as the filter (e.g Bookings, Capacity, Lead Time). To customize which tiles listen to the filter, when adding/editing the filter, click the Tiles To Update tab.
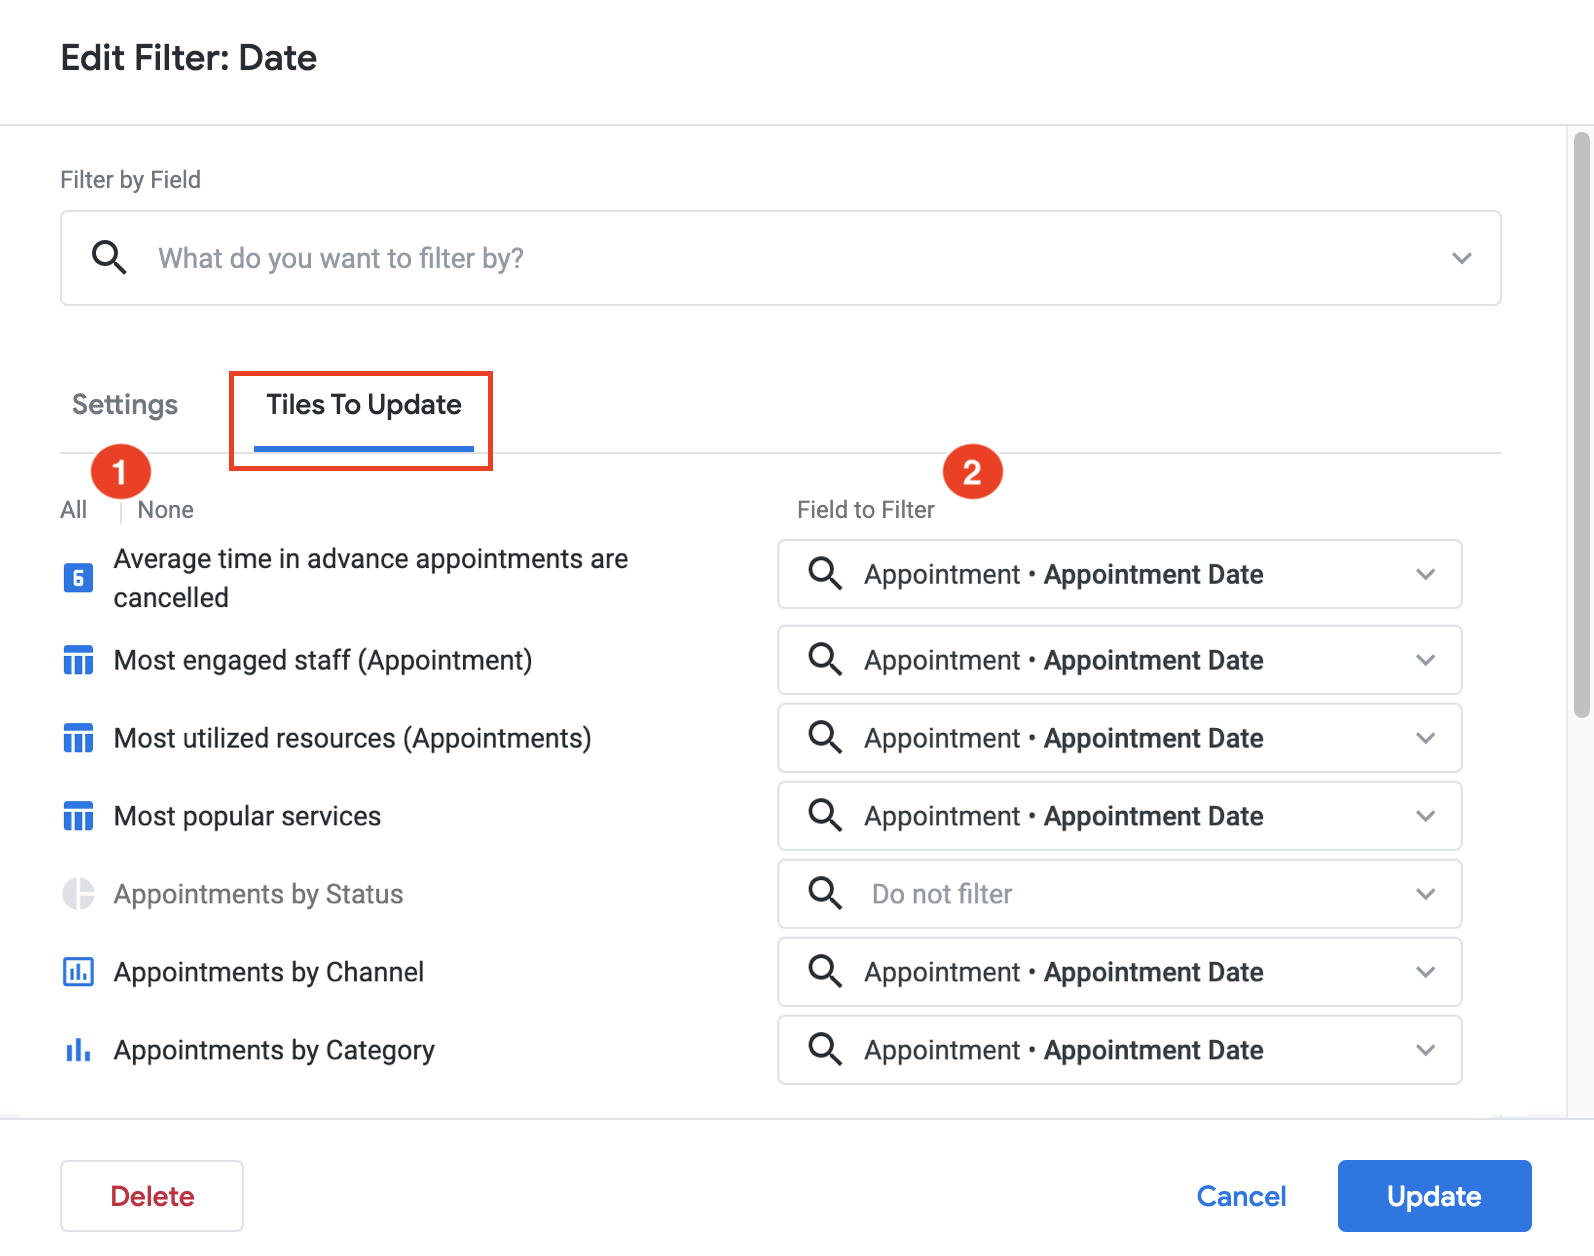
- Click All or None to enable/disable the filter on all tiles.
- Under Field to Filter select which fields will be affected by the filter, or choose to turn off the filter for for a tile by selecting "Do not filter".
Adding a filter to a report (Look)
- Navigate to a report you wish to add a filter to, and click Edit or Explore. Alternatively, you can start adding filters during report creation.
- Locate a field (dimension or measure) that you wish to apply a filter for:
- Use the field picker from the left-hand menu and click the filter icon, or;
- Click the gear/cog icon > Filter to apply a filter to a field in use already
- Your selected field will be added to the Filters section.
- Use the drop-down lists, calendar widgets, or text fields (provided depending on field type) to put in your restriction.
- Click the Run button to see your filter in action.
You can add multiple fields to a filter, including multiple filters per field, and an AND/OR condition will be created (depending on the type of filter option). Use the + or x icons to add/remove filters.
In the example above, we’re choosing to only display days with an appointment count of more than 100, or less than 50, but excluding days with a total of 5, 12, and 150 appointments.
JRNI insider tips
Looking for some filters to get you started? Some of the most popular filters used by JRNI customers include the following:
- Store/Branch: Name of the child company where the booking took place.
- Region: Name of the parent company where the booking took place.
- Appointment Date: Date and time when the booking takes place.
- Service: Name of the service linked to the booking.
Search for one of these using the field picker on the Explore (or report editor page) and use the filter icons to set your own criteria.
Related articles
Still have questions?
If you have any questions about filtering data, or using/accessing JRNI Analytics Plus, please contact JRNI Customer Support, who will be happy to help.