Using JRNI
Appointments
Creating and managing bookings via Call Center
Personal Booking Links
Locating bookings and customers
Resolving conflicting shift patterns
Locations overview
Creating pre and post appointment questions
Changing the staff member or resource on an upcoming booking
Adding attendees to existing and upcoming bookings
Rescheduling and canceling bookings
Blocking out time on the calendar
Creating appointment bookings
Calendar overview
Parent and Child level overview
Using Check In for appointments
Staff
Editing and removing staff members
Configuring availability by method
Creating staff members
Creating and managing staff availability
Creating availability for multi-location staff
Services
Creating and editing Services
Service image requirments
Private services
Categories
Configuring the reservation workflow
Creating service schedules
Resources
Analytics
All Dashboards
Using the Capacity Dashboard
Using the Basic Dashboard
Using the Event Dashboard
Using the Conversion Dashboard
Using the HQ Dashboard
Using the Appointment Dashboard
Using the lead time dashboard
Insight Hub *New*
Creating dashboards
Creating Your First Dashboard - Format Tab Section Overview
Creating Your First Dashboard - Simple Steps
Creating Your First Dashboard - Interactive Elements Overview
Creating Your First Dashboard - Chart Components Overview
Creating Your First Dashboard - Data Tab Overview
Features
The new jrni Insight Hub
Analytics overview
Creating your own Reports
Google Analytics - New Customer Journeys
Setting up KPI targets and alerts
Drilling down into your data
Using Table Calculations
Filtering Dashboard and Report data
Creating and modifying a Dashboard
Sending, scheduling, and downloading Reports/Dashboards
Exploring the library of Dashboards and Reports
Booking journeys
Customer Journey's (Journey Builder)
Journey builder
Link Builder
Multi Service Journeys (Appointments)
How to use iframes
How to deeplink into booking journeys
Direct Links
Customer Journeys
Appointment automation
Queuing
Real-time Dashboard
Overview of the Concierge page
Setting up a virtual queue
Overview of JRNI Virtual Queuing
Setting up and managing a display board
Managing live queues via the Concierge page
How customers can join a live queue
Events
Events setup and config
Event journeys
Events Staff Experience
Events Bulk Import
*New* Event landing page builder
Branding
Business info
How to translate your content
Account Settings & Administration
Understanding user roles and permissions
How to reset or update your JRNI password
Creating and managing user access
Connectors & API
Calendar
Video
CRM
Salesforce
Guide to Salesforce Integration with JRNI
Add BookingBug updates to Chatter
Set up a booking journey in Salesforce
Manage user permissions and profiles
Use Studio inside Salesforce
Standard and Custom object mapping
Link JRNI staff to Salesforce users
Map customers, appointments and events
Set up the data sync
SAML
Integrating with Yext for JRNI Appointments
Release notes
Upcoming Release notes - 15th of July 2026
Release notes - 1st of July 2026
Release notes - 10th of June 2026
Release notes - April 2026
Release Notes - March 2026
(December - January 2026)
V8.21-V.8.21.2 (November 2025)
V.8.19-V.8.21 (October 2025)
V.8.17-V.8.18 (September 2025)
V8.15-V.8.16 (August 2025)
V.8.12 - V8.14 (July 2025)
V.8.11 (June 2025)
V8.10.1-V.8. (May 2025)
V8.10 - V8.11 (March 2025)
V8.8 - V.8.9 (February 2025)
V8.6 - V8.7 (January 2025)
V8.30 -V8.40 (November 2024)
V8.50 (December 2024)
V8.20 (October 2024)
V8.00-V8.10 (September 2024)
V7.55-V7.57 (August 2024)
V7.54 - V7.55 (July 2024)
V7.52-V7.53 (June 2024)
V7.49-V.51(May 2024)
V.7.47-V.7.48 (April 2024)
V.7.46 - V7.47 (March 2024)
V.7.45 (February 2024)
V7.42 - V.7.44 (January 2024)
V7.41.0 (Dec 14 2023)
V7.40.0 (December 11 2023)
V7.39.0 (December 1 2023)
V7.38.0 (November 20 2023)
V7.37.0 (Nov 7 2023)
V7.36.0 (Oct 30 2023)
V7.35.0 (Oct 18 2023)
V7.34.0 (Oct 13 2023)
V7.33.0 (Sep 28 2023)
V7.32.0 (Sep 28 2023)
V7.31.0 (Sep 20 2023)
V7.30.0 (Sep 20 2023)
V7.29.0 (Sep 7 2023)
V7.28.0 (Aug 29 2023)
V7.27.0 (Aug 29 2023)
V7.26.0 (Aug 20 2023)
V7.25.0 (Aug 9 2023)
V7.24.0 (Aug 9 2023)
V7.23.0 (July 31 2023)
V7.22.0 (July 24 2023)
V7.21.0 (July 18 2023)
V7.20.0 (July 5 2023)
V7.19.0 (June 29 2023)
V7.18.0 (June 26 2023)
V7.17.0 (June 14 2023)
V7.1.0 (March 6 2023)
V7.2.0 (March 8 2023)
V7.0.0 (February 9 2023)
V7.16.0 (June 8 2023)
V7.15.0 (June 1 2023)
V7.14.0 (June 7 2022)
V7.11.0 (April 24 2023)
V7.10.0 (April 20 2023)
V7.9.0 (April 12 2023)
V7.8.0 (April 5 2023)
V7.7.0 (March 30 2023)
V7.6.0 (March 29 2023)
V7.5.1 (March 20 2023)
V7.5.0 (March 16 2023)
V7.4.0 (March 11 2023)
V7.3.0 (March 9 2023)
- All Categories
- Using JRNI
- Analytics
- Insight Hub *New*
- Creating dashboards
- Creating Your First Dashboard - Chart Components Overview
Creating Your First Dashboard - Chart Components Overview
 Updated
by JRNI
Updated
by JRNI
📊Chart Components Overview
The Chart Component is the main visualization element in jrni Insight Hub dashboards. The chart component automatically connects to your selected dataset and updates when filters or variables change on the dashboard. Here's how to use it:
- Configuring Your Chart
- Drag and drop a "Chart Component" from the component panel onto your dashboard canvas. You'll see a shadow indicating where it will be placed.
- Double-click the chart component to open the editor in the left panel. The editor has three main sections:
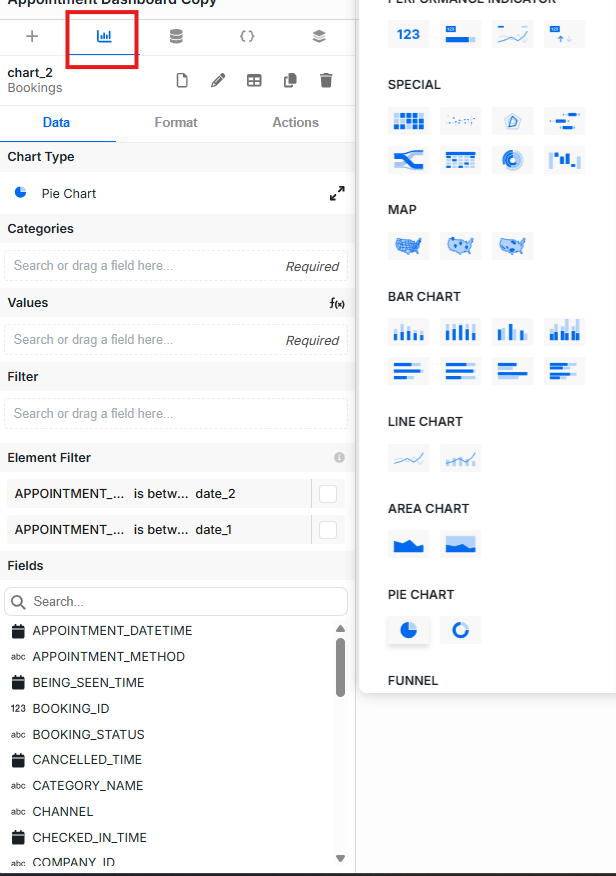
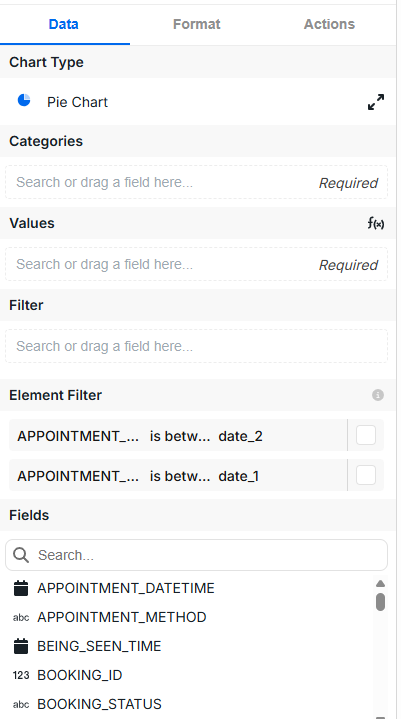
- Data Tab
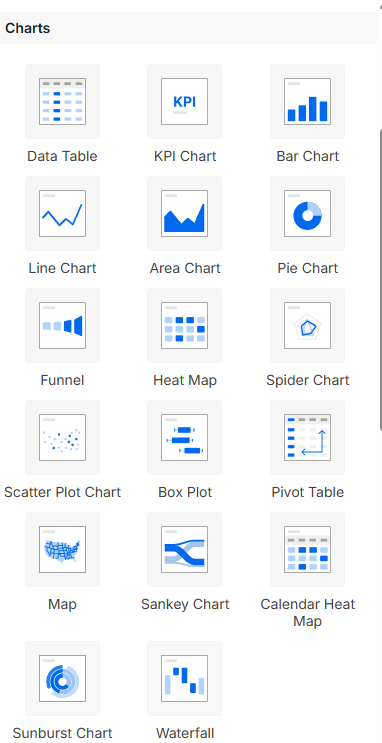
- Chart Type: Choose from bar charts, line charts, pie charts, tables, etc.
- Categories/Rows: Select fields to group your data by
- Values: Choose which fields to aggregate (sum, count, average, etc.)
- Filter: Add filters to show specific data subsets
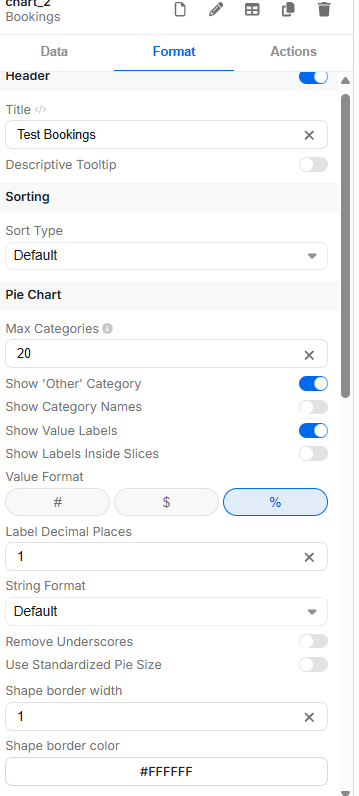
- Format Tab - You will find items like the following below
- Header: Set chart title and tooltip descriptions
- Sorting Type: Default, Values or Categories
- Chart Customization: Customizing how the Chart is shown by (Show 'Other' Category, Show Category Names, Show Value Labels, Show Labels Inside Slices, etc.)
- Data Labels: Customize how data appears in tooltips
- Colors: Choose color palettes for your visualization
- Legend: Configure legend placement and styling
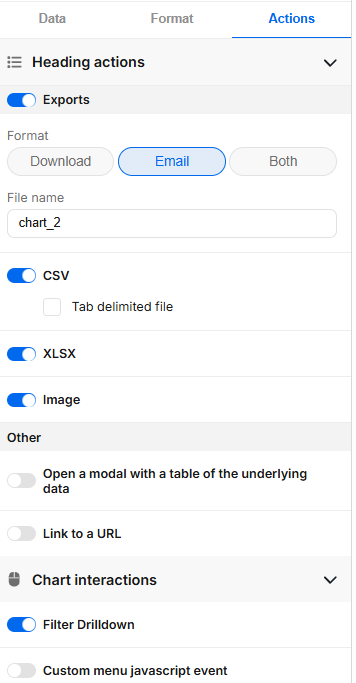
- Actions Tab -
- Link Button: Creates a clickable button that takes the user to an external website, another dashboard, or a specific view.
- Download Button: Allows users to download a table or chart’s data, typically in CSV format, directly from the dashboard.
- Email Button: Allows the user to email the report to the needed parties.
- Open Modal: Opens a small pop-up window (modal) that can show text, images, or other custom content to provide additional information.
- Trigger Alert: Displays a simple on-screen message when the user clicks the button, such as a confirmation or notification.
- Run Custom Code: Enables advanced users to connect the button to custom functions or external systems for more complex actions (generally requires developer setup).
Need help setting up or managing dashboard? Contact support or your CSM— we’re here to help.