Using JRNI
Appointments
Creating and managing bookings via Call Center
Personal Booking Links
Locating bookings and customers
Resolving conflicting shift patterns
Locations overview
Creating pre and post appointment questions
Changing the staff member or resource on an upcoming booking
Adding attendees to existing and upcoming bookings
Rescheduling and canceling bookings
Blocking out time on the calendar
Creating appointment bookings
Calendar overview
Parent and Child level overview
Using Check In for appointments
Staff
Editing and removing staff members
Configuring availability by method
Creating staff members
Creating and managing staff availability
Creating availability for multi-location staff
Services
Creating and editing Services
Service image requirments
Private services
Categories
Configuring the reservation workflow
Creating service schedules
Resources
Analytics
All Dashboards
Using the Capacity Dashboard
Using the Basic Dashboard
Using the Event Dashboard
Using the Conversion Dashboard
Using the HQ Dashboard
Using the Appointment Dashboard
Using the lead time dashboard
Insight Hub *New*
Creating dashboards
Creating Your First Dashboard - Format Tab Section Overview
Creating Your First Dashboard - Simple Steps
Creating Your First Dashboard - Interactive Elements Overview
Creating Your First Dashboard - Chart Components Overview
Creating Your First Dashboard - Data Tab Overview
Features
The new jrni Insight Hub
Analytics overview
Creating your own Reports
Google Analytics - New Customer Journeys
Setting up KPI targets and alerts
Drilling down into your data
Using Table Calculations
Filtering Dashboard and Report data
Creating and modifying a Dashboard
Sending, scheduling, and downloading Reports/Dashboards
Exploring the library of Dashboards and Reports
Booking journeys
Customer Journey's (Journey Builder)
Journey builder
Link Builder
Multi Service Journeys (Appointments)
How to use iframes
How to deeplink into booking journeys
Direct Links
Customer Journeys
Appointment automation
Queuing
Real-time Dashboard
Overview of the Concierge page
Setting up a virtual queue
Overview of JRNI Virtual Queuing
Setting up and managing a display board
Managing live queues via the Concierge page
How customers can join a live queue
Events
Events setup and config
Event journeys
Events Staff Experience
Events Bulk Import
*New* Event landing page builder
Branding
Business info
How to translate your content
Account Settings & Administration
Understanding user roles and permissions
How to reset or update your JRNI password
Creating and managing user access
Connectors & API
Calendar
Video
CRM
Salesforce
Guide to Salesforce Integration with JRNI
Add BookingBug updates to Chatter
Set up a booking journey in Salesforce
Manage user permissions and profiles
Use Studio inside Salesforce
Standard and Custom object mapping
Link JRNI staff to Salesforce users
Map customers, appointments and events
Set up the data sync
SAML
Integrating with Yext for JRNI Appointments
Release notes
Upcoming Release notes - 15th of July 2026
Release notes - 1st of July 2026
Release notes - 10th of June 2026
Release notes - April 2026
Release Notes - March 2026
(December - January 2026)
V8.21-V.8.21.2 (November 2025)
V.8.19-V.8.21 (October 2025)
V.8.17-V.8.18 (September 2025)
V8.15-V.8.16 (August 2025)
V.8.12 - V8.14 (July 2025)
V.8.11 (June 2025)
V8.10.1-V.8. (May 2025)
V8.10 - V8.11 (March 2025)
V8.8 - V.8.9 (February 2025)
V8.6 - V8.7 (January 2025)
V8.30 -V8.40 (November 2024)
V8.50 (December 2024)
V8.20 (October 2024)
V8.00-V8.10 (September 2024)
V7.55-V7.57 (August 2024)
V7.54 - V7.55 (July 2024)
V7.52-V7.53 (June 2024)
V7.49-V.51(May 2024)
V.7.47-V.7.48 (April 2024)
V.7.46 - V7.47 (March 2024)
V.7.45 (February 2024)
V7.42 - V.7.44 (January 2024)
V7.41.0 (Dec 14 2023)
V7.40.0 (December 11 2023)
V7.39.0 (December 1 2023)
V7.38.0 (November 20 2023)
V7.37.0 (Nov 7 2023)
V7.36.0 (Oct 30 2023)
V7.35.0 (Oct 18 2023)
V7.34.0 (Oct 13 2023)
V7.33.0 (Sep 28 2023)
V7.32.0 (Sep 28 2023)
V7.31.0 (Sep 20 2023)
V7.30.0 (Sep 20 2023)
V7.29.0 (Sep 7 2023)
V7.28.0 (Aug 29 2023)
V7.27.0 (Aug 29 2023)
V7.26.0 (Aug 20 2023)
V7.25.0 (Aug 9 2023)
V7.24.0 (Aug 9 2023)
V7.23.0 (July 31 2023)
V7.22.0 (July 24 2023)
V7.21.0 (July 18 2023)
V7.20.0 (July 5 2023)
V7.19.0 (June 29 2023)
V7.18.0 (June 26 2023)
V7.17.0 (June 14 2023)
V7.1.0 (March 6 2023)
V7.2.0 (March 8 2023)
V7.0.0 (February 9 2023)
V7.16.0 (June 8 2023)
V7.15.0 (June 1 2023)
V7.14.0 (June 7 2022)
V7.11.0 (April 24 2023)
V7.10.0 (April 20 2023)
V7.9.0 (April 12 2023)
V7.8.0 (April 5 2023)
V7.7.0 (March 30 2023)
V7.6.0 (March 29 2023)
V7.5.1 (March 20 2023)
V7.5.0 (March 16 2023)
V7.4.0 (March 11 2023)
V7.3.0 (March 9 2023)
Table of Contents
- All Categories
- Using JRNI
- Analytics
- All Dashboards
- Using the Event Dashboard
Using the Event Dashboard
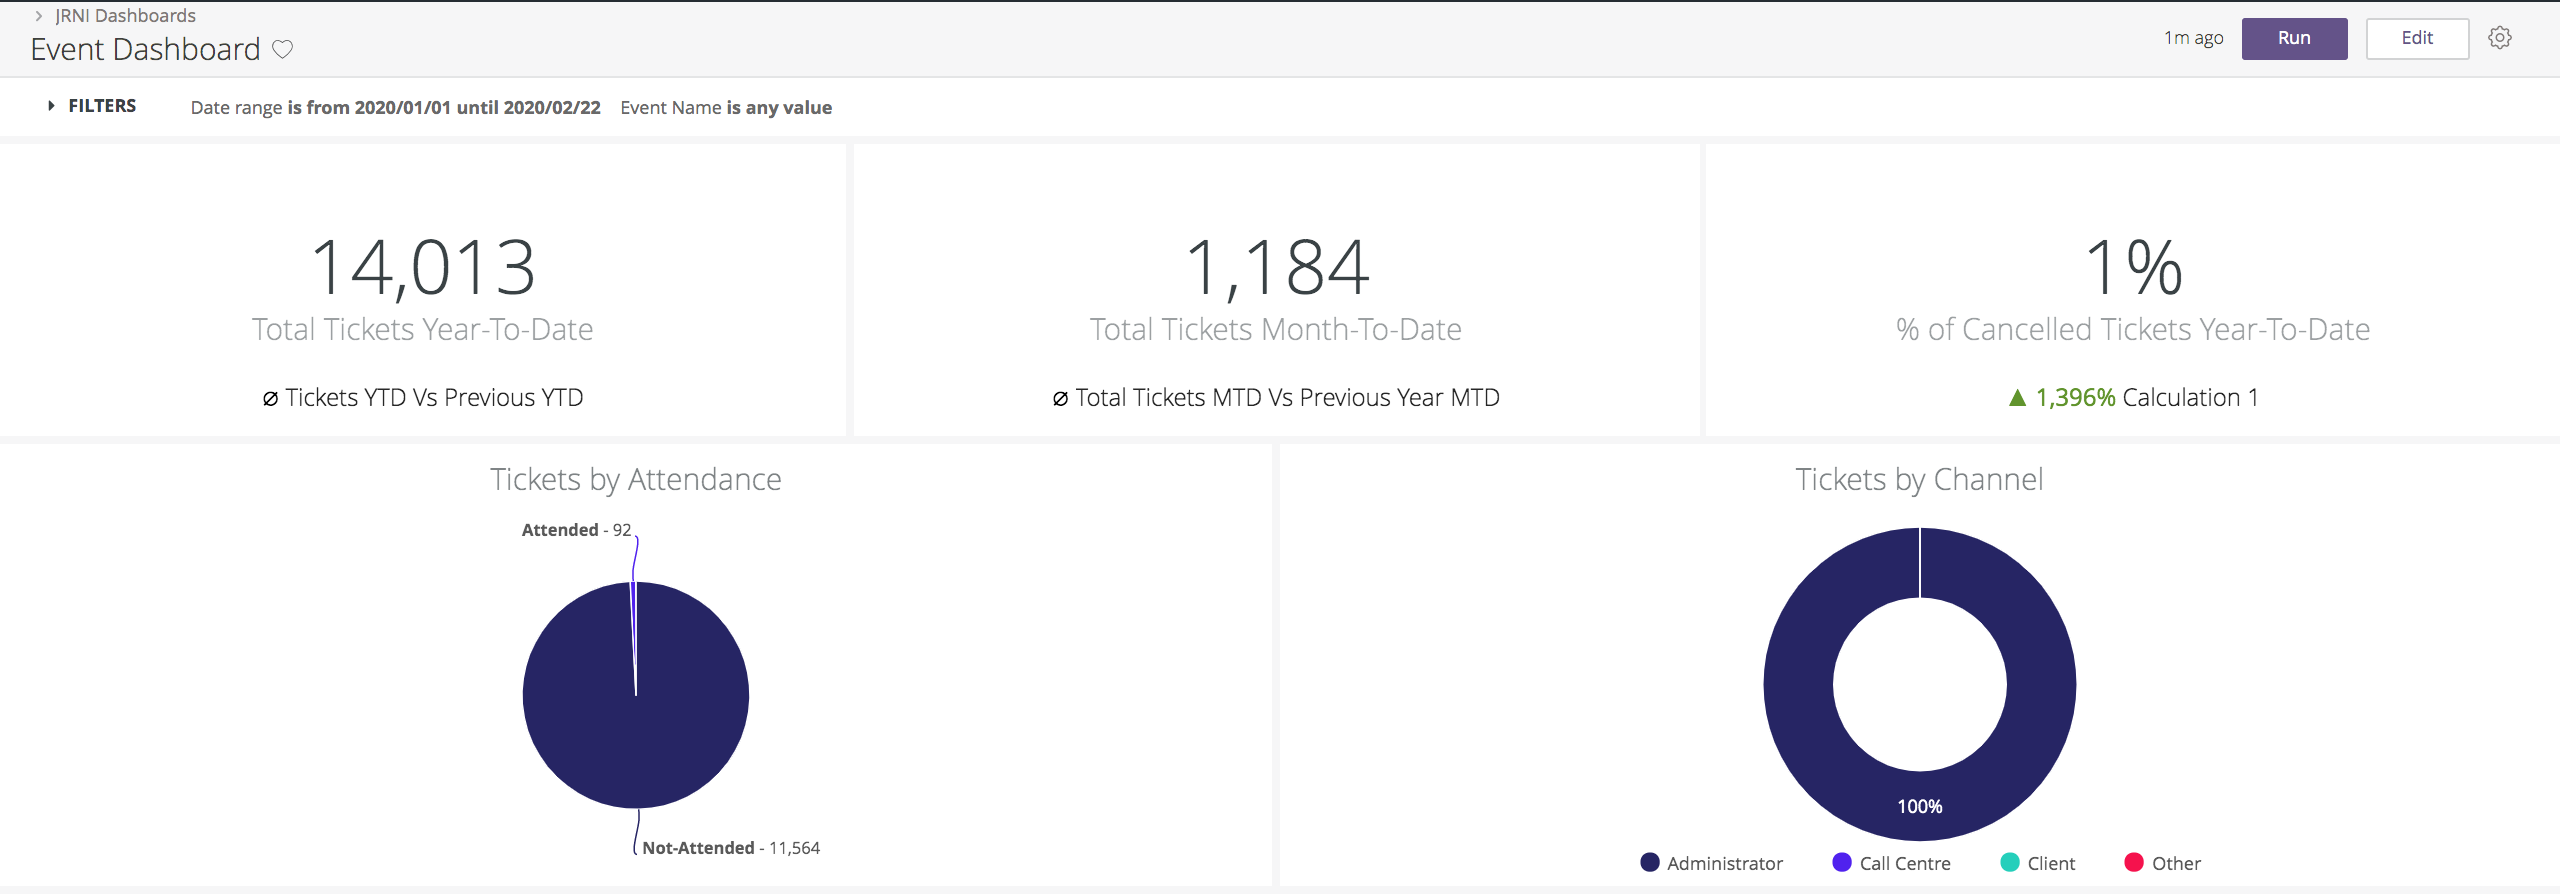
The Event Dashboard in JRNI Analytics Essentials and JRNI Analytics Plus shows performance of events in a specific region/location.
Report types
JRNI Analytics comes with a template library of reports (Looks) which, for the Event Dashboard, includes the below:
- Total tickets today: total number of tickets today and change vs. yesterday
- Total tickets cancelled today: total number cancelled tickets and change vs. yesterday
- Overview of events: overview of the events taking place within a date range, including number of tickets booked, reserved, blocked and in waiting
- Total tickets this week: total number this week vs. last week
- Total cancellations this week: total number cancelled vs. last week
- Average days tickets booked in advance: average number of days an event is booked in advance of the scheduled date
- Average days tickets cancelled in advance: Average number of days a ticket is cancelled in advance of the scheduled date
- Most engaged staff: compare the number of tickets booked per staff
- Most utilized resources: compare the number of tickets booked per resource
- Most popular events: compare the number of tickets booked per event
- Tickets by attendance: compare number of tickets by attendance, based on a date range filter
- Tickets by event group: compare number of tickets per event group, based on a date range filter
- Tickets by channel: compare number of tickets per channel, based on a date range filter
With Analytics Plus, on top of viewing the Event Dashboard, existing reports can be removed and newly-created reports can be added.
FAQs and Troubleshooting
Downloading the dashboard and/or its reports
You are able to download the entire Event Dashboard, or the individual reports displayed, as a PDF or CSV file. To learn more, visit our guide on Sending, scheduling and downloading reports/dashboards.
Drilling into dashboard data
As you hover your mouse over the reports displayed on the Event Dashboard, you’ll notice certain clickable elements. By clicking on these you have the power to drill further into the data in various ways. To learn more, visit our guide on Drilling down into your data.
Changes have been made to the Event Dashboard
Customization to the Event Dashboard can only be made by Analytics Plus users. However, any changes made will be visible to all Analytics users (including Essentials).
Still have questions?
If you have further questions about accessing/using the Event Dashboard, please contact JRNI Customer Support, who will be happy to help.