Using JRNI
Appointments
Creating and managing bookings via Call Center
Personal Booking Links
Locating bookings and customers
Resolving conflicting shift patterns
Locations overview
Creating pre and post appointment questions
Changing the staff member or resource on an upcoming booking
Adding attendees to existing and upcoming bookings
Rescheduling and canceling bookings
Blocking out time on the calendar
Creating appointment bookings
Calendar overview
Parent and Child level overview
Using Check In for appointments
Staff
Editing and removing staff members
Configuring availability by method
Creating staff members
Creating and managing staff availability
Creating availability for multi-location staff
Services
Creating and editing Services
Service image requirments
Private services
Categories
Configuring the reservation workflow
Creating service schedules
Resources
Analytics
All Dashboards
Using the Capacity Dashboard
Using the Basic Dashboard
Using the Event Dashboard
Using the Conversion Dashboard
Using the HQ Dashboard
Using the Appointment Dashboard
Using the lead time dashboard
Insight Hub *New*
Creating dashboards
Creating Your First Dashboard - Format Tab Section Overview
Creating Your First Dashboard - Simple Steps
Creating Your First Dashboard - Interactive Elements Overview
Creating Your First Dashboard - Chart Components Overview
Creating Your First Dashboard - Data Tab Overview
Features
The new jrni Insight Hub
Analytics overview
Creating your own Reports
Google Analytics - New Customer Journeys
Setting up KPI targets and alerts
Drilling down into your data
Using Table Calculations
Filtering Dashboard and Report data
Creating and modifying a Dashboard
Sending, scheduling, and downloading Reports/Dashboards
Exploring the library of Dashboards and Reports
Booking journeys
Customer Journey's (Journey Builder)
Journey builder
Link Builder
Multi Service Journeys (Appointments)
How to use iframes
How to deeplink into booking journeys
Direct Links
Customer Journeys
Appointment automation
Queuing
Real-time Dashboard
Overview of the Concierge page
Setting up a virtual queue
Overview of JRNI Virtual Queuing
Setting up and managing a display board
Managing live queues via the Concierge page
How customers can join a live queue
Events
Events setup and config
Event journeys
Events Staff Experience
Events Bulk Import
*New* Event landing page builder
Branding
Business info
How to translate your content
Account Settings & Administration
Understanding user roles and permissions
How to reset or update your JRNI password
Creating and managing user access
Connectors & API
Calendar
Video
CRM
Salesforce
Guide to Salesforce Integration with JRNI
Add BookingBug updates to Chatter
Set up a booking journey in Salesforce
Manage user permissions and profiles
Use Studio inside Salesforce
Standard and Custom object mapping
Link JRNI staff to Salesforce users
Map customers, appointments and events
Set up the data sync
Integrating with Yext for JRNI Appointments
Release notes
Upcoming Release notes - 15th of July 2026
Release notes - 1st of July 2026
Release notes - 10th of June 2026
Release notes - April 2026
Release Notes - March 2026
(December - January 2026)
V8.21-V.8.21.2 (November 2025)
V.8.19-V.8.21 (October 2025)
V.8.17-V.8.18 (September 2025)
V8.15-V.8.16 (August 2025)
V.8.12 - V8.14 (July 2025)
V.8.11 (June 2025)
V8.10.1-V.8. (May 2025)
V8.10 - V8.11 (March 2025)
V8.8 - V.8.9 (February 2025)
V8.6 - V8.7 (January 2025)
V8.30 -V8.40 (November 2024)
V8.50 (December 2024)
V8.20 (October 2024)
V8.00-V8.10 (September 2024)
V7.55-V7.57 (August 2024)
V7.54 - V7.55 (July 2024)
V7.52-V7.53 (June 2024)
V7.49-V.51(May 2024)
V.7.47-V.7.48 (April 2024)
V.7.46 - V7.47 (March 2024)
V.7.45 (February 2024)
V7.42 - V.7.44 (January 2024)
V7.41.0 (Dec 14 2023)
V7.40.0 (December 11 2023)
V7.39.0 (December 1 2023)
V7.38.0 (November 20 2023)
V7.37.0 (Nov 7 2023)
V7.36.0 (Oct 30 2023)
V7.35.0 (Oct 18 2023)
V7.34.0 (Oct 13 2023)
V7.33.0 (Sep 28 2023)
V7.32.0 (Sep 28 2023)
V7.31.0 (Sep 20 2023)
V7.30.0 (Sep 20 2023)
V7.29.0 (Sep 7 2023)
V7.28.0 (Aug 29 2023)
V7.27.0 (Aug 29 2023)
V7.26.0 (Aug 20 2023)
V7.25.0 (Aug 9 2023)
V7.24.0 (Aug 9 2023)
V7.23.0 (July 31 2023)
V7.22.0 (July 24 2023)
V7.21.0 (July 18 2023)
V7.20.0 (July 5 2023)
V7.19.0 (June 29 2023)
V7.18.0 (June 26 2023)
V7.17.0 (June 14 2023)
V7.1.0 (March 6 2023)
V7.2.0 (March 8 2023)
V7.0.0 (February 9 2023)
V7.16.0 (June 8 2023)
V7.15.0 (June 1 2023)
V7.14.0 (June 7 2022)
V7.11.0 (April 24 2023)
V7.10.0 (April 20 2023)
V7.9.0 (April 12 2023)
V7.8.0 (April 5 2023)
V7.7.0 (March 30 2023)
V7.6.0 (March 29 2023)
V7.5.1 (March 20 2023)
V7.5.0 (March 16 2023)
V7.4.0 (March 11 2023)
V7.3.0 (March 9 2023)
- All Categories
- Using JRNI
- Queuing
- Real-time Dashboard
Real-time Dashboard
 Updated
by JRNI
Updated
by JRNI
The Real-Time Dashboard provides live visibility into the performance of your queues as they operate. Through a combination of interactive graphs and at-a-glance count metrics, you can monitor staff availability, customer flow, wait times, and queue outcomes, all updating automatically, without refreshing the page.
Accessing the Real-Time Dashboard
The Real-Time Dashboard is found in jrni Studio under Analytics > Queue dashboard in the left-hand navigation.
Before you can access the dashboard, the following must be in place:
- Your organization must have an active jrni Virtual Queuing subscription
- The Real-Time Dashboard feature must be enabled for your account by your Customer Success Manager or Technical Account Manager
- At least one queue must be configured in your company
If you do not see “Queue dashboard” in your Analytics navigation, contact your Customer Success Manager to request enablement.
User roles and permissions
Access to the Real-Time Dashboard is restricted by user role. Only the following Studio roles can view the dashboard:
- Owner - Full access
- Admin - Full access
- Manager - Full access
The Challenge It Solves
Without a real-time view, understanding how your queues are performing typically means relying on delayed reports, fragmented data from different systems, or manual spot-checks by staff on the ground. This makes it difficult to:
- Identify queue bottlenecks before they escalate into long customer wait times
- Understand how effectively staff are being utilized at any given moment
- React quickly when wait times rise or customers begin dropping off
- Get a single, unified picture of queue health across your location
The Real-Time Dashboard eliminates these blind spots by delivering live, actionable data directly to the people who need it from branch managers to senior leadership.
Key Benefits
Live Operational Visibility
See exactly what is happening across your queues right now, without waiting for end-of-day reports or manual updates.
Faster Decision-Making
Spot rising wait times, growing queues, or idle staff immediately and take corrective action before customers are impacted.
Smarter Staff Allocation
See which staff are available, who is currently serving, and where capacity is underutilized then adjust in real time.
Reduced Drop-Offs
Monitor drop-off rates live and intervene early to keep customers engaged and reduce abandonment.
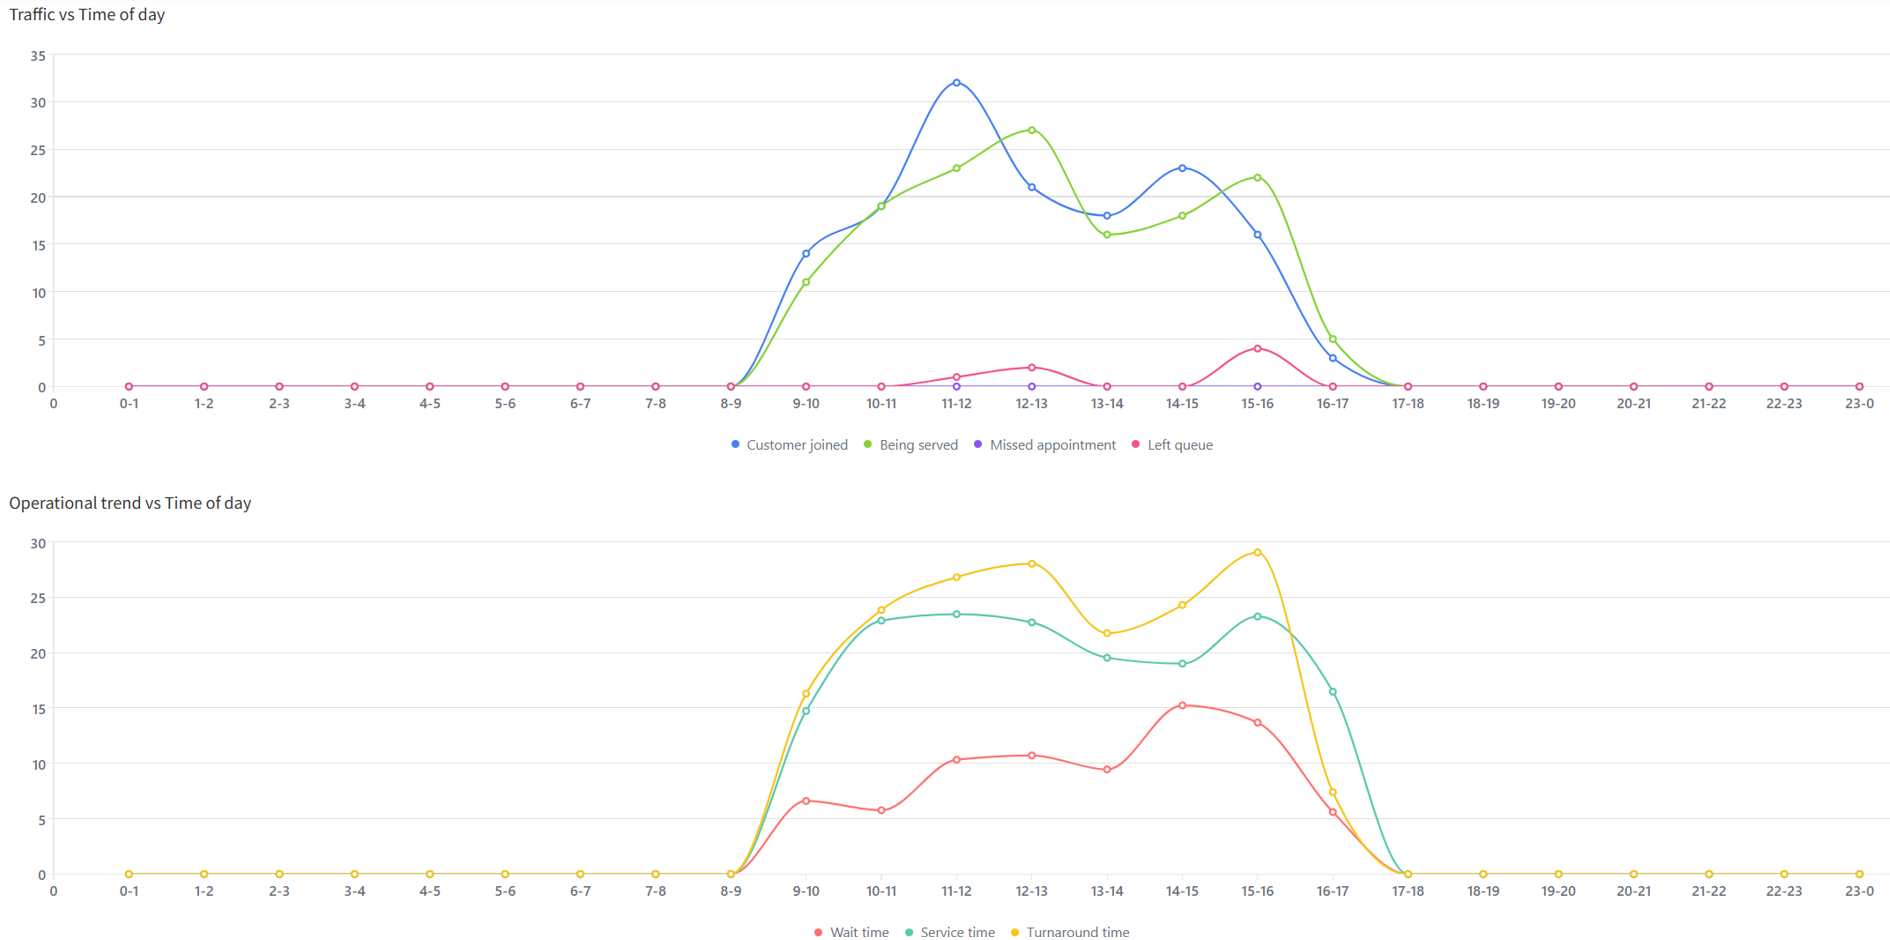
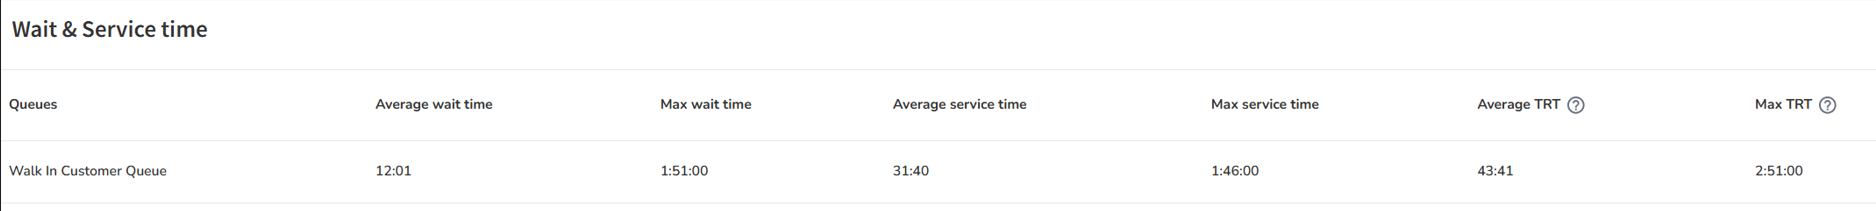
Understanding Wait Time, Service Time, and Turnaround Time
The dashboard tracks three timing metrics that together describe the full customer experience from the moment they join a queue to the moment their service is complete.
Wait Time
Wait time measures how long a customer spends waiting in the queue before a staff member picks them up. The clock starts when the customer joins the queue and stops when a staff member begins serving them.
A high wait time typically indicates that demand is exceeding staff capacity. If you notice wait times increasing during certain hours, consider scheduling additional staff during those periods.
Service Time
Service time measures how long the actual interaction between the staff member and the customer takes. The clock starts when the staff member begins serving the customer and stops when the service is marked as complete.
Longer service times are not necessarily a problem, some services naturally take longer than others. However, consistently high service times across a queue may indicate a need for process improvements.
Turnaround Time (TRT)
Turnaround time is the total end-to-end duration of a customer’s experience, calculated as wait time + service time. It represents the full time from when the customer joins the queue to when their service is complete.
This is the metric most closely aligned with overall customer satisfaction, as it captures the entire experience rather than just one phase.
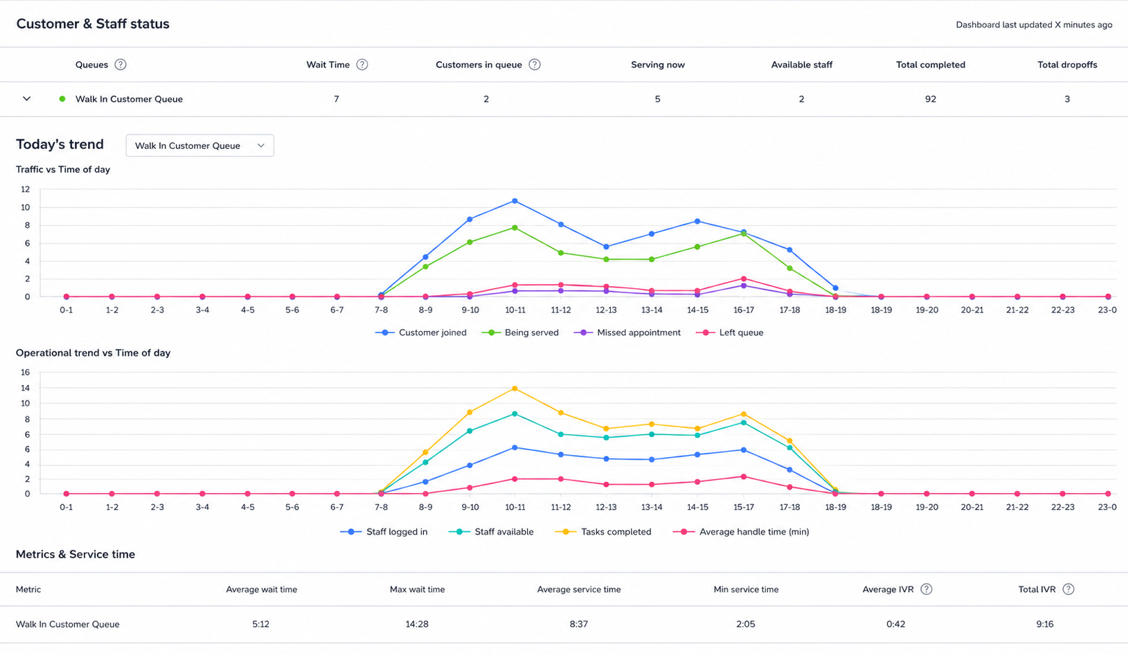
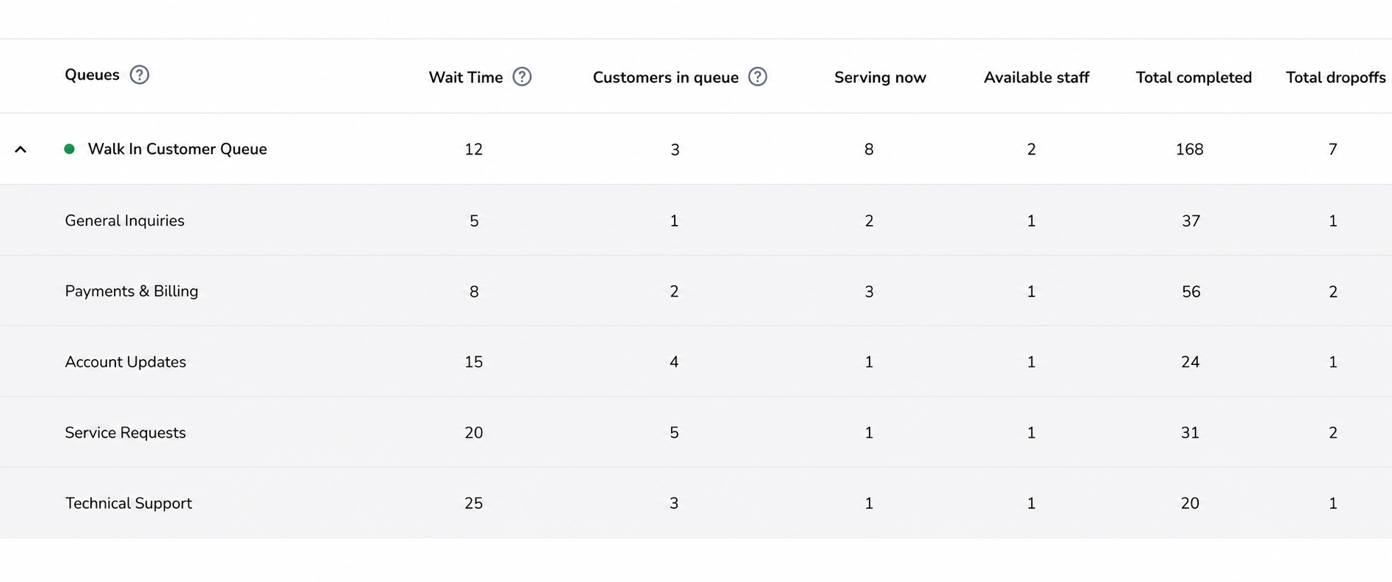
Dashboard Metrics
The Real-Time Dashboard displays six core metrics, each presented as both a numerical count and an interactive graph. Every metric updates instantly as queue events occur — when a customer joins, is served, completes their visit, or leaves the queue.
Available Staff
Shows the number of staff members who are currently logged in and available to serve the next customer in the queue. This count updates immediately whenever a staff member's status changes — for example, when they begin serving a customer, go on break, or become available again.
Customers in Queue
Displays the current number of customers waiting in the virtual queue. The count increases when a new customer joins and decreases when a customer is called to be served or leaves the queue voluntarily.
Customers Being Served
Reflects the number of customers who are currently in an active service interaction with a staff member. This metric stays in sync with both the Available Staff and Customers in Queue counts, giving you a complete picture of current capacity usage.
Average Wait Time
Calculates the mean time customers are spending in the queue before being served. This metric updates dynamically as the queue flow changes throughout the day, reflecting the most current conditions.
Completed Queues
A running count of customers who have been served and whose queue journey has been marked as complete. This number increases each time a customer interaction finishes successfully.
Dropped-Off Queues
Captures the number of customers who left the queue before being served. This includes customers who voluntarily abandoned the queue as well as those who timed out. The metric is displayed in both a count view and a trend graph so you can see not just the total but also when drop-offs are happening.
Enabling the Real-Time Dashboard
The Real-Time Dashboard is available for all organizations with JRNI Virtual Queuing. To get it activated for your account, reach out to your Customer Success or Technical Account Manager who will enable the feature and walk you through the initial setup.